Connecting the Dots
of Network Science

Connecting the Dots
of Network Science
In both nature and society, we are immersed in networks of many kinds. Understanding the dynamics and complexities of those networks can help us understand their behavior and predict their evolution.
Everyone has friends, colleagues, neighbors and relatives, all interconnected within a much larger social system. These personal links create a network in which the theory of six degrees of separation manifests itself, an idea first credited to Hungarian writer, Frigyes Karinthy, almost a century ago. As Karinthy wrote in 1929 about a character in one of his short stories, “Chains,” “He offered a bet that we could name any person among earth’s one-and-a-half billion inhabitants and through at most five acquaintances, one of which he knew personally, he could link to the chosen one.”
That would prove to be a pretty good wager. Nearly 40 years later, with the world’s population topping 3.5 billion, American social psychologist Stanley Milgram conducted an experiment to prove Karinthy’s theory. Milgram asked 300 randomly selected Midwesterners to deliver a package to a Boston stockbroker by mailing it to the one of their friends most likely to know the broker. If that person wasn’t familiar with the broker, he or she would send the package to an acquaintance most likely to know him. Milgram discovered that it took six steps, on average, for the package to reach its destination.
Today the earth’s population has more than doubled, to 7.6 billion, but our interconnectedness has never been greater, thanks to technology, the Internet and social media. Facebook alone has more than 2 billion monthly active users, each averaging 338 friends; any pair of them is connected by a chain that averages only 3.5 people, according to the social network’s own research.
In our everyday lives, we use networks to, among other things, find jobs, share opinions and keep in touch with loved ones. We negotiate complex transportation networks and enjoy the fruits of intricate supply-chain networks when we buy groceries. But networks are not only transmitters of information, traffic and products; their structures also encode valuable clues to fundamental differences among companies, which we can identify and even quantify. By using knowledge acquired through network science, we can seek to make more accurate predictions in many previously opaque situations, from the diffusion of epidemics to the assessment of credit in the developing world. Network science’s insights and tools can even be applied to the stock market, enabling the development of models that incorporate insights into the characteristics of the underlying market network.
Superstars and Wealth Inequality
The mathematical basis for making scientific claims about networks emerged from the field of graph theory, founded by Leonhard Euler, a Swiss mathematician, physicist, astronomer, logician and engineer, through his work on the so-called Königsberg problem in 1736. That problem revolved around the question of whether it was possible to tour the once-Prussian, now Russian city Kaliningrad by traversing each of its seven bridges just once (see Figure 1).
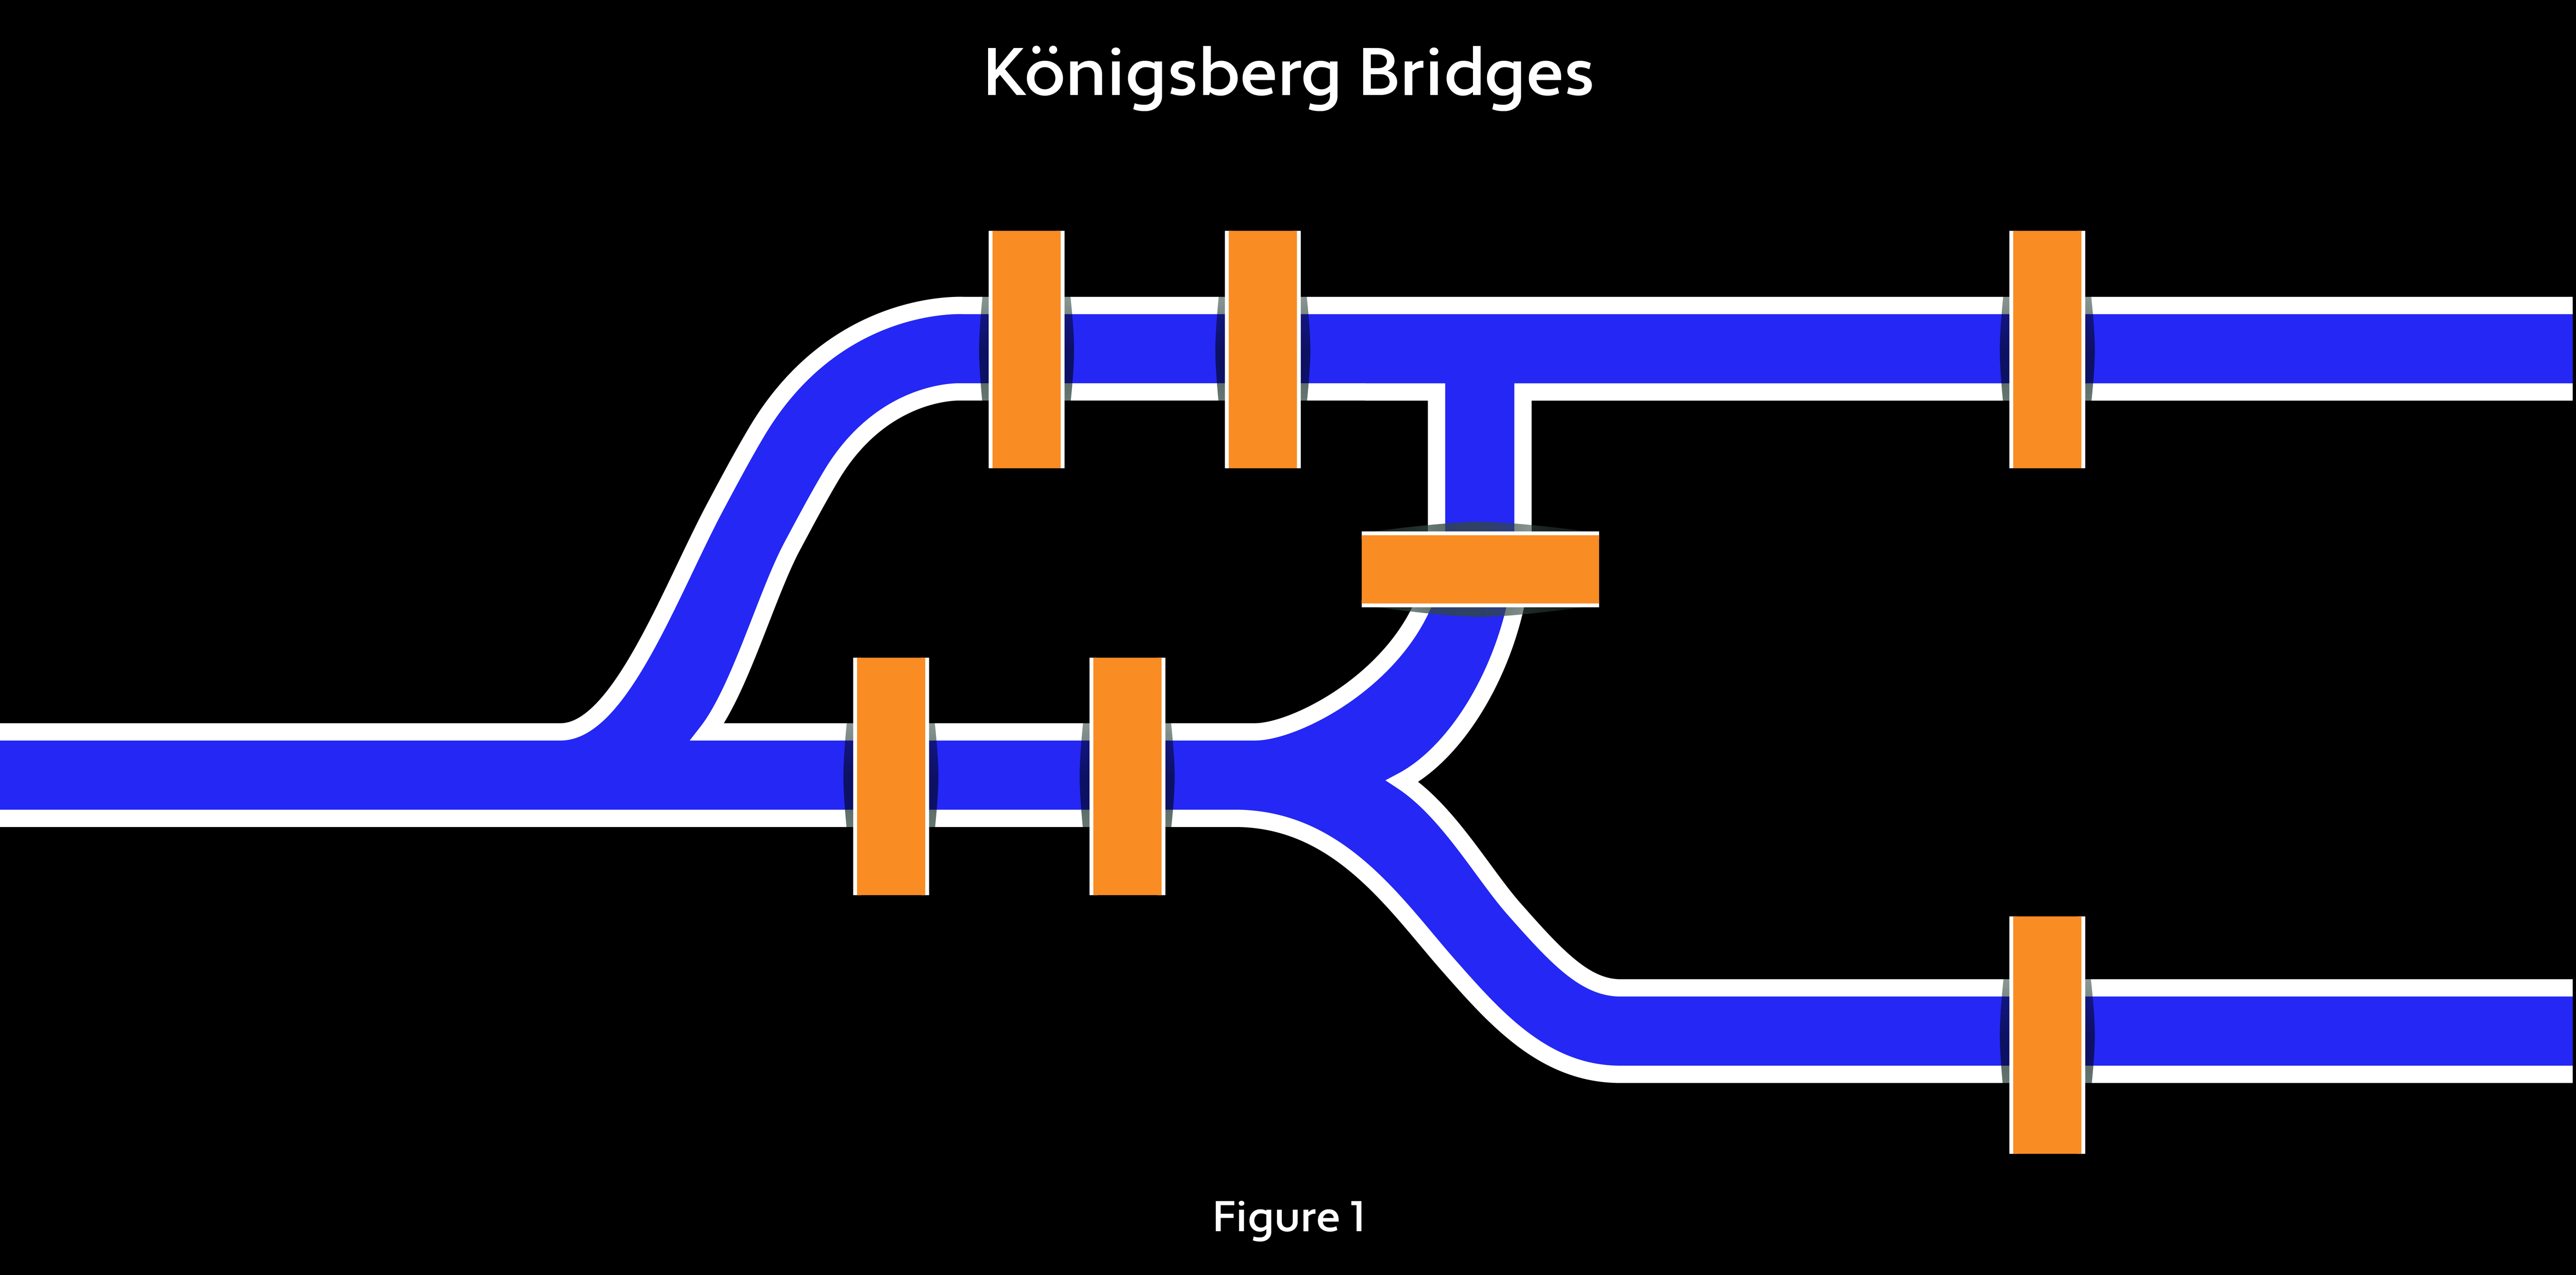
Euler made a useful abstract leap when he realized that only the bridges — called links in network science — and the terrains they connected — or nodes — needed to be considered to answer the question. The network could be embodied in a graph. A trip on this network is called a path; one that ends where it begins is a cycle. Euler proved that such a cycle (now known as the Euler cycle) could not exist in Königsberg. To pass over each bridge just once, Euler realized, would require every node to have an even number of links — an equal number of exits and entrances — and therefore an equal, or even, number of neighboring nodes. But in fact, three nodes have three links and one has five. A tourist would eventually face the reality of either skipping a bridge or passing over one twice.
This example suggests that a crucial concept in network science is the neighbor count (also known as the degree distribution) describing how many average links connect a node to the rest of the network, and the standard deviation of this quantity.
In terms of real-life human traits, like height or IQ, the distribution of people’s friends resembles a bell curve. In 1959, at the start of the modern theory of networks, two Hungarian mathematicians, Paul Erdős (one of the most prolific mathematicians in history, having published some 1,500 papers with more than 500 collaborators) and Alfréd Rényi (one of the most influential figures in information theory), proposed a model that describes the world as a cocktail party. Assuming that people randomly bump into conversational partners with whom they will become friends, Erdős and Rényi showed that the resulting distribution of friend networks is a bell curve with only natural numbers as its values — a so-called Poisson distribution.
Does this simple model capture the reality of everyday networks? It does exhibit the “small-worldness” of Milgram’s six degrees of separation, but some of the obvious characteristics of real networks are not exhibited in the Erdős-Rényi model. Consider the existence of “superstars.” If the distribution reflects the Erdős-Rényi model, everyone should have roughly the same number of friends, with no differences in orders of magnitude.
In real networks, however, the degree distributions reflect power laws, or so-called Pareto distributions, which statistically result in the 80/20 rule: 80 percent of the population possesses 20 percent of the total wealth. In network terms, 80 percent of the links belong to 20 percent of the nodes. A model developed by two of the founders of network science, physicist Albert-László Barabási and biophysicist Réka Albert, explains the formation of such inequalities by positing a variation on the cocktail party setting: Yes, the world is a cocktail party, but one in which everyone prefers to chat with the most influential people — that is, with the superstars. This effect is known as preferential attachment. As people arrive at the party, they do not just randomly bump into fellow partygoers but search for those who already have many friends, so they can integrate more easily into the emerging community structure.
This mechanism allows us to understand an important factor in the evolution of networks such as company affiliations and supply-chain connections. The more neighbors an entity has, the more connected it is and the more future opportunities exist as a growing number of newcomers link to it. So a good neighborhood — a densely connected network — provides advantages for companies not only in the present but in the future. This mechanism allows a more fundamental understanding of the well-known concept of the first-mover advantage. If you arrive at a party early, there’s a good chance that the next few attendees will chat with you — they don’t really have a choice — making you an organic part of the network and laying the base for future success. From a business point of view, think of companies like Coca-Cola, whose brand name is one of its key sources of value, or Amazon.com, which recognized that first moving to build an online bookselling network, then adapting that network for shopping generally, would be essential to its success.
The power-law distribution is a universal property of real-life networks, and we can use it to measure how skewed or heterogeneous the statistical distribution is in a network. The value of this exponent tells us a lot about a network’s structure. For example, we can predict a network’s robustness — its ability to withstand failures and perturbations — using the Molloy-Reed criterion, a statistical insight based on the observation that if a node makes a connection, or link, between two other nodes, it must have at least two neighbors. Molloy-Reed can be used to derive a critical threshold: the point when the network begins to break down. This criterion suggests that if the distribution reflects a power law but is not too skewed, the system is stable. To break the network, you would have to remove all of the nodes. But if the system is heterogeneous, it can be broken by randomly removing a fixed fraction of its nodes. The fraction that has to be removed is a lot lower if the process is not random, as in the case of a targeted attack on key nodes or hubs.
These general statements can be applied to supply chains and other real-life situations. The higher the heterogeneity (that is, the larger the power-law exponent) of a supply chain’s degree distribution, the less robust it is. This gives us a way to quantify the robustness of entire networks, which can be useful in assessing differences among economies and industries. But we are also interested in risks on the company and stock level. To pursue this kind of focused understanding, we need to dig deeper into the structure of networks and grasp what kind of measures can help us quantify network-related properties at finer resolutions.
Divide and Conquer
Clustering is a widely used technique for making predictions about the correlation of stocks. In many cases, you can use historical price data to build correlation matrices that help you measure the distance between each pair of stocks. Different clustering techniques can then be applied from machine learning to define these groups.
In network science, a cluster is essentially a community — a number of strongly interconnected nodes; you can think of it as an extended neighborhood in which there is a high proportion of internal connections to external ones. In the case of networks, most of the information can be encoded in a topology, the mathematical study of space, showing interrelationships of connections, rather than using a matrix that summarizes the pairwise differences. For example, not every pair of nodes has a readily assigned distance between them. To put it another way, not every city has a direct road connection to every other city; you may have to reach your destination by passing through more than one city. The basic advantage of a network-based approach is that it leads to clusters having fundamental, instead of historical, reasons for exhibiting internal correlations. If some companies are strongly interconnected through supply-chain-based connections, they rely on one another’s success through common products, partnerships and customer-supplier relationships.
One of the most widely used network-clustering algorithms shows the power of these interdisciplinary interactions: The Infomap algorithm combines concepts of graph theory and information theory, and is based on an ingenious definition of optimal clustering. The idea behind it can be understood by the etymology of the term “infomap,” which blends “information” and “map.” The procedure tries to find the most informationally optimal way of describing explorations of networks on a map. These exploring “trips” could range from scholars reading their way through a field’s literature to molecular biologists working out biochemical pathways to travelers driving from one city to another.
How would you efficiently describe a car route? To describe travel within a city (a cluster in the travel network), you don’t need to assign a unique city and street identifier to each location; once you state that you’re in a city, you can just use street identifiers. If a city is a cluster, driving from city to city requires using a set group of intercity highways. Conversely, if you don’t know the cities, you can find them by minimizing the information needed to encode a random route. The idea is that the best hypothesis for a set of data is the one that leads to the most compressed data — what’s called the minimal description-length function. By breaking down a network this way, Infomap naturally describes its hierarchies of clusters.
In the end, it’s always easier to understand some complicated structures by trying to identify their components, thus separating the problem into parts, such as intercomponent and intracomponent dynamics. Using methods similar to the Infomap algorithm, you can cluster companies based on supply-chain (or other types of) networks. In the case of stock price predictions, such a separation involves decoupling co-movement and individual trends.
The Spotlight
Network science helps answer questions that were previously almost impossible to quantify, such as, What are the most important nodes in a network? The quantities that provide solutions to this question are called centrality measures in graph theory. For an easy-to-grasp example, recall the earlier discussion about the degree distribution of the network. Based on the concept of preferential attachment, and on our everyday experiences, those who have more acquaintances, or connections, tend to be superstars. Thus, the most trivial centrality we can define is the degree of centrality: the number of neighbors a node possesses.
However, the power of centralities is not limited to summarizing local properties. You can also aggregate information about the entire network and calculate a given node’s position in it as a number. Two examples will show that this is possible and that different centrality measures can illustrate different important aspects: betweenness centrality and PageRank.
As its name suggests, betweenness centrality is the number of shortest paths in the graph going through a given node. What are the most important intersections in a city? If intersections with high betweenness centrality fail, traffic participants may find that many of their shortest paths to their destinations will be affected. This measure grasps the risk that the system will face severe consequences if the node is eliminated, with many paths getting longer and many that were previously not heavily used suddenly flooded with traffic. The analogy can be applied to supply-chain networks and the role that a company plays in the circulation of a product in a market. This means a risk from the economy’s point of view and an additional support received by the central company from other players (because its elimination would harm the entire system).
PageRank is the algorithm that made Google so successful at ranking search results in its early years. The score given to a node, or website, is proportional to the frequency with which random walkers would hit it. These walkers model human web-surfing behavior: For these purposes, surfers mostly follow random links, but from time to time they arbitrarily switch to a new topic or website. The centrality measure is the stationary state of this process. So PageRank is one of the key factors in determining which hubs need to be immunized to diminish the effects of, say, a virus spreading. In the case of markets, it is a useful tool for finding stocks that may have a strong influence on their neighbors, so it can be used when modeling network shock waves, such as news or earnings announcements.
In most of these cases, simply being in an influential position provides a competitive advantage as more information, products and cash circulate, opening opportunities unattainable for those on the peripheries. Quantitative studies confirm these tendencies. To highlight just one example, Chinese automobile companies that have centrality appear to have a statistically higher than average impact on innovation.
The concepts of network science, such as clusters and centrality measures, may be computationally and mathematically challenging, but they are fundamental and essential for understanding complex interconnected systems. They can be successfully used to try to predict the fate of companies, thus providing additional lenses to investigate stock participants. Moreover, as the spider of our modern civilization weaves its web more and more densely — through personal connections, roads, electricity and telecom systems, smartphones and the Internet of Things — our lives and the dynamics of our society cannot be separated from the structures of these underlying networks. Who wouldn’t like to better understand life and society?
Zsombor Koman is a Vice President, Research, at WorldQuant and has a BSc in physics from Hungary’s Eötvös Loránd University.
Endnotes
Sherzod Aktamov and Yan Zhao. “Impact of Network Centrality Positions on Innovation Performance of the Firm: Evidence from China Automobile Industry.” Business Management and Strategy 5, no. 1 (2014): 164.
Albert-László Barabási and Réka Albert. “Emergence of Scaling in Random Networks.” Science 286, no. 5439 (1999): 509-12.
Albert-László Barabási. Linked: How Everything Is Connected to Everything Else and What It Means for Business, Science, and Everyday Life. Plume, 2003.
Albert-László Barabási. Network Science. Cambridge University Press, 2016.
Smriti Bhagat, Moira Burke, Carlos Diuk, Ismail Onur Filiz and Sergey Edunov. “Three and a Half Degrees of Separation.” Facebook Research, 2016.
Paul Erdős and Alfréd Rényi. “On Random Graphs, I.” Publicationes Mathematicae 6 (1959): 290-97.
Leonhard Euler. “Solutio problematis ad geometriam situs pertinentis.” Commentarii Academiae Scientiarum Imperialis Petropolitanae 8 (1736): 128-40.
Frigyes Karinthy. “Chains.” Everything Is Different (1929).
Mark Newman, Albert-László Barabási and Duncan J. Watts. The Structure and Dynamics of Networks. Princeton University Press, 2011.
David Frederick Ross. Distribution Planning and Control. Springer, 2015.
Martin Rosvall and Carl T. Bergstrom. “Maps of Random Walks on Complex Networks Reveal Community Structure.” Proceedings of the National Academy of Sciences 105, no. 4 (2008): 1118-23.
Tianhui Tan, Prasanta Bhattacharya and Tuan Phan. “Credit-Worthiness Prediction in Microfinance Using Mobile Data: A Spatio-Network Approach.” Proceedings of the International Conference on Information Systems — Digital Innovation at the Crossroads (2016).
Stanley Milgram. “The Small World Problem.” Psychology Today 1, no. 1 (1967): 61-7.
Jeffrey Travers and Stanley Milgram. “An Experimental Study of the Small World Problem.” Social Networks (1977): 179-97.
Disclaimer
Thought Leadership articles are prepared by and are the property of WorldQuant, LLC, and are being made available for informational and educational purposes only. This article is not intended to relate to any specific investment strategy or product, nor does this article constitute investment advice or convey an offer to sell, or the solicitation of an offer to buy, any securities or other financial products. In addition, the information contained in any article is not intended to provide, and should not be relied upon for, investment, accounting, legal or tax advice. WorldQuant makes no warranties or representations, express or implied, regarding the accuracy or adequacy of any information, and you accept all risks in relying on such information. The views expressed herein are solely those of WorldQuant as of the date of this article and are subject to change without notice. No assurances can be given that any aims, assumptions, expectations and/or goals described in this article will be realized or that the activities described in the article did or will continue at all or in the same manner as they were conducted during the period covered by this article. WorldQuant does not undertake to advise you of any changes in the views expressed herein. WorldQuant and its affiliates are involved in a wide range of securities trading and investment activities, and may have a significant financial interest in one or more securities or financial products discussed in the articles.


